
PREVIOUS
Blog
Reading a microsphere data sheet with the right context
Understand the Numbers Behind Microsphere Data Sheets
Read the grade, measurement basis and document revision before comparing microsphere properties.
A microsphere technical data sheet (TDS) can help you select a material, calculate its contribution to a formulation and identify the tests needed before use. But a number on a data sheet is meaningful only when you understand what it measures, how it was obtained and which material it describes.
Four distinctions make the difference: particle volume versus powder-bed volume, median particle size versus the full distribution, typical properties versus acceptance requirements, and laboratory survival results versus performance in a real process.
Table of Contents:
Related 3M™ Ceramic Microspheres Articles
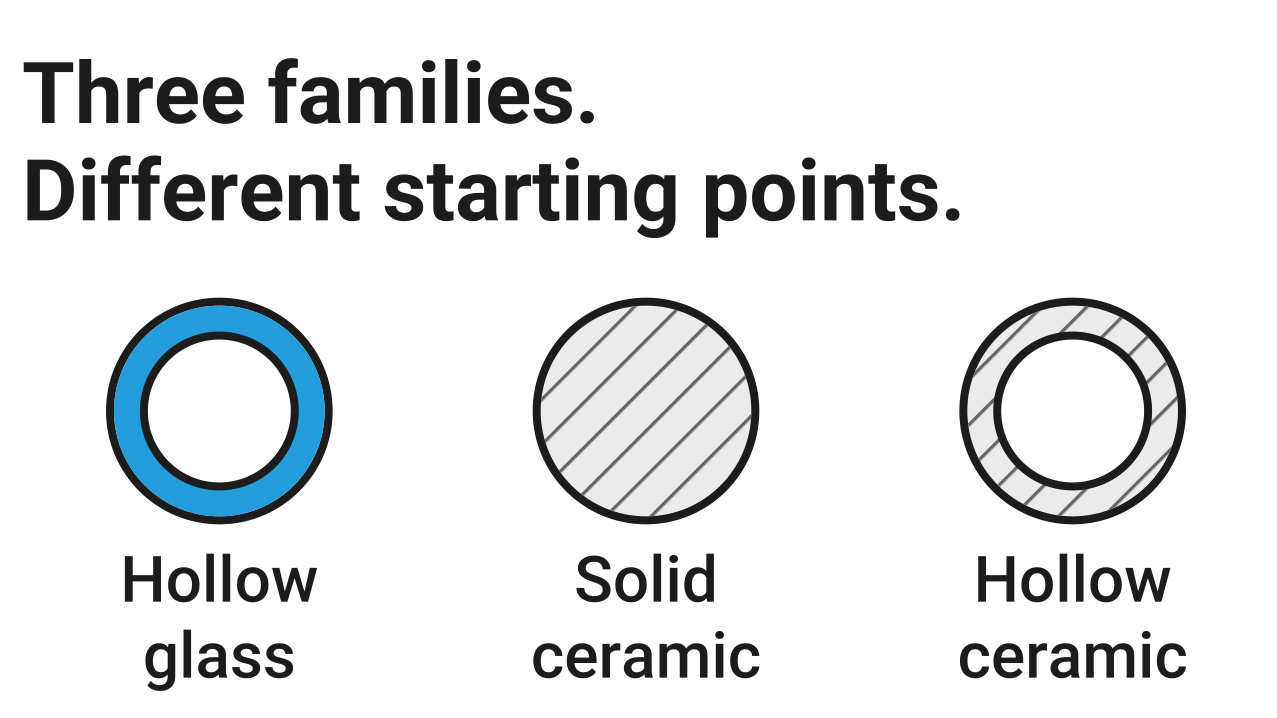
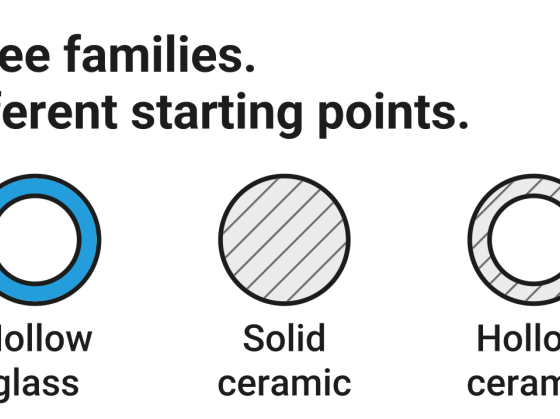
Three Functional Filler Families and How to Choose Where to Start

Enhancing Paints & Coatings with 3M™ Ceramic Microspheres

Unlocking the Potential of Functional Fillers in Waterborne, UV-Curable Coatings
Start with the exact material and grade
Before comparing properties, identify the material family, specific grade, document revision and technical source. Similar product names do not establish equivalent particle characteristics or performance.
Keep each property attached to its original grade and document. If two records differ, establish whether their definitions, methods and material scope are comparable before interpreting the difference.
Choose the right density for the calculation
Density is mass divided by a defined volume. For microsphere powders, the critical question is which volume the reported density represents.
Particle density relates mass to a defined volume of the particles themselves. Bulk density relates the powder's mass to the volume occupied by the powder bed, including the spaces between particles. These are different quantities and serve different purposes.
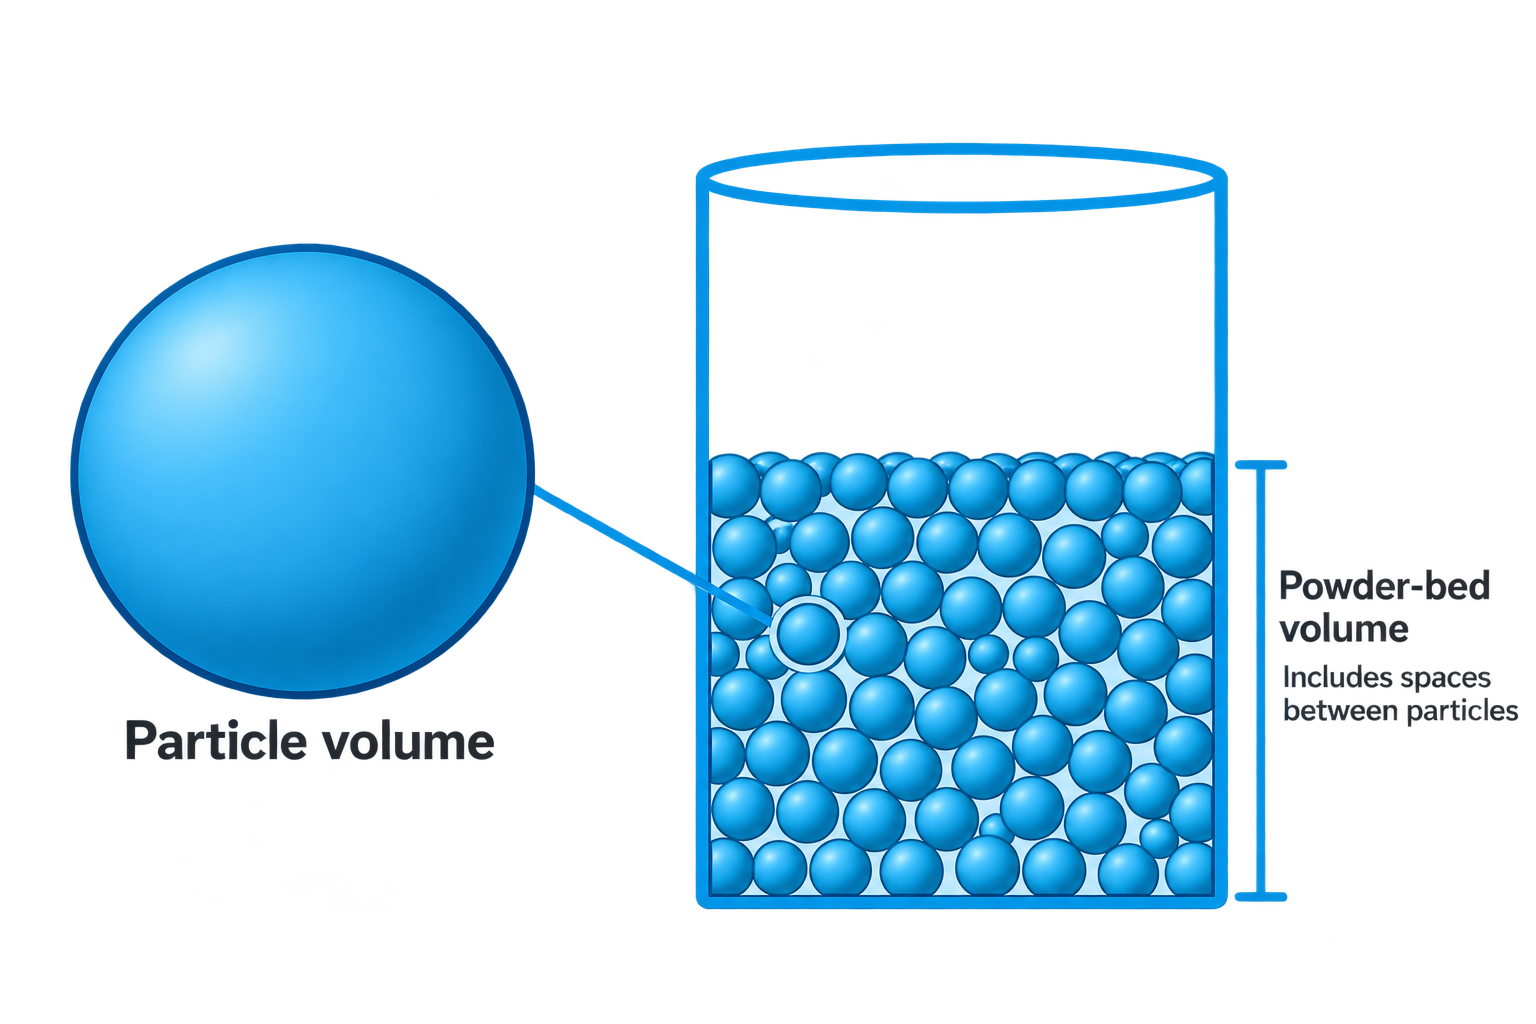
For a solid-particle powder, particle volume excludes the spaces between particles; powder-bed volume includes them.
Imagine pouring a fixed mass of powder into a container. The loose powder may occupy more space than the same mass after a defined tapping procedure, because the particles rearrange and some of the spaces between them become smaller. The mass has not changed, but the powder-bed volume has.
Bulk density therefore depends on packing and the stated filling or settling conditions. Tapped density describes the powder bed after a defined mechanical tapping procedure. Results obtained under different procedures should not automatically be treated as equivalent.
This distinction affects two separate decisions.
- For a formulation volume calculation, use the appropriate particle-density basis. Using bulk density instead would include interparticle spaces in the calculated filler volume, potentially misrepresenting the amount of solid material being added.
- For handling, storage and container planning, bulk density can be directly relevant because it helps describe how much space a given powder mass occupies under comparable conditions.
Hollow and porous particles require additional care. Depending on the measurement method, internal pores may be included in or excluded from the defined volume. Terms such as particle density, true density and skeletal density should not automatically be treated as synonyms. The method and volume definition determine what the reported value means.
Confirm the measurement definition and packing conditions when the document does not provide them.
Read particle-size data beyond the median
Particle-size distribution (PSD) describes how particle sizes are distributed across a material. Percentiles summarise that distribution.
D10, D50 and D90 are the particle sizes below which 10%, 50% and 90%, respectively, of the stated distribution fall. D50 is the median, not the mean. The interpretation depends on how the distribution is weighted and how particle size was measured.
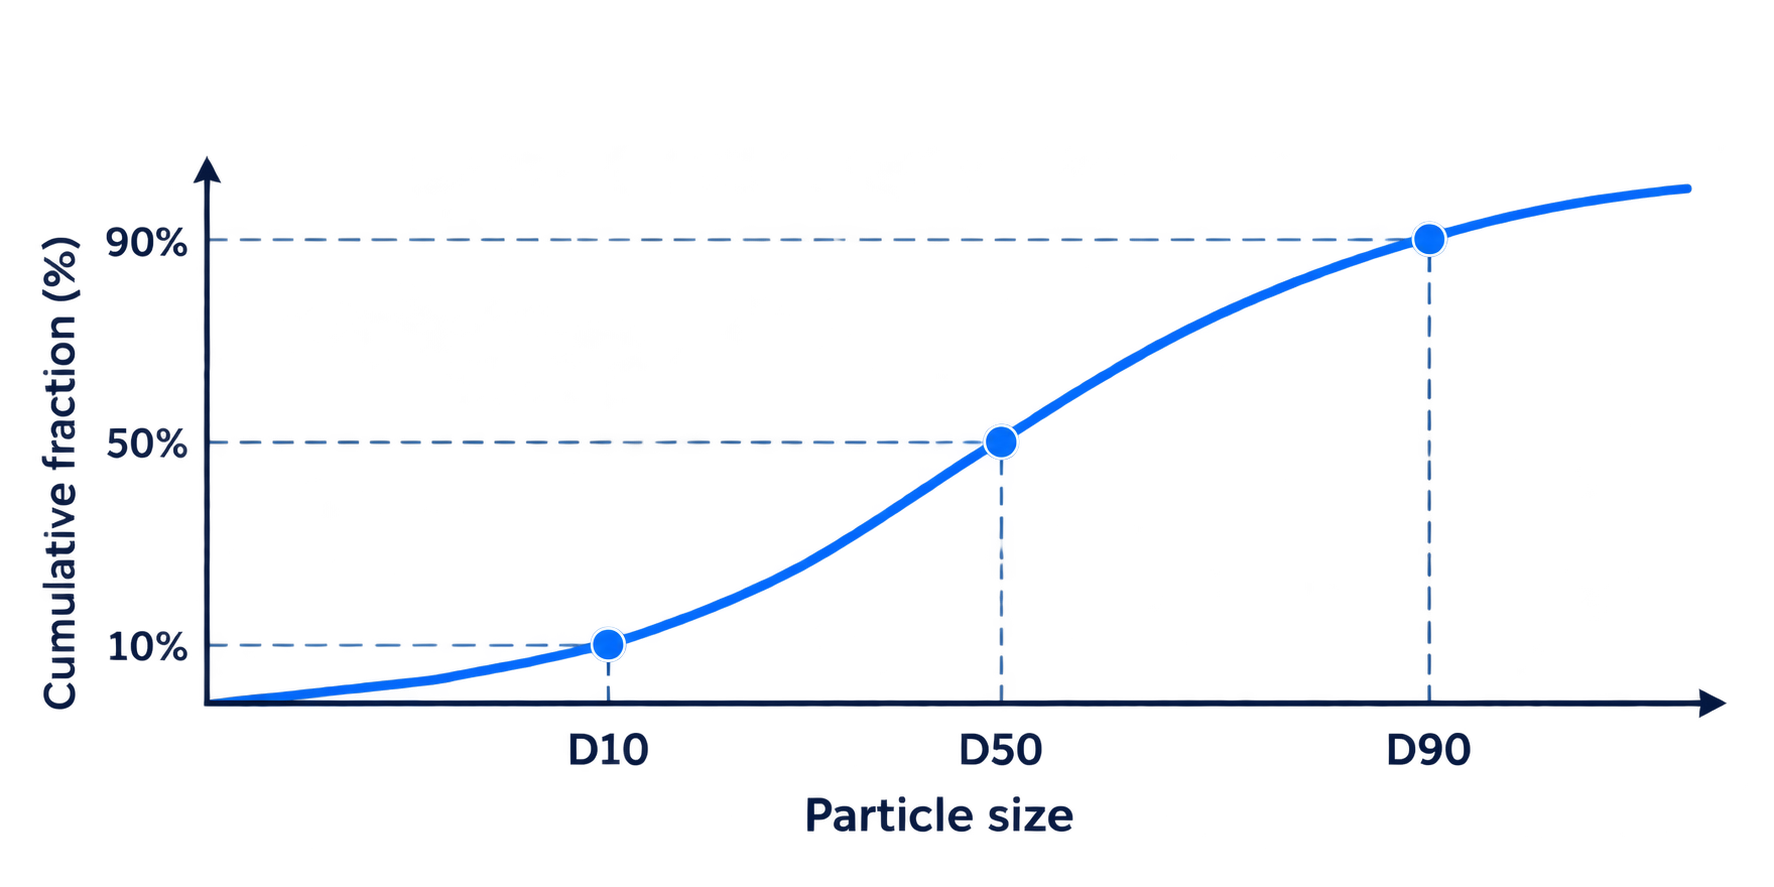
D10, D50 and D90 indicate the 10th, 50th and 90th percentiles of a hypothetical particle-size distribution.
Weighting changes what those percentages represent:
- Number weighting: Each particle contributes equally, regardless of its size.
- Volume weighting: Each particle contributes according to its volume, so larger particles can have a much greater influence.
- Mass weighting: Each particle contributes according to its mass.
Mass-weighted and volume-weighted distributions are equivalent only when particle density is uniform across the size distribution. The measurement method matters too, because different methods can produce different particle-size results.
Consider two hypothetical powders measured using the same method and weighting. Both have the same D50. In the first powder, particle sizes are relatively concentrated around the median. In the second, the distribution contains a more pronounced coarse fraction. The powders can share the same D50 while having different D90 values.
The median alone therefore cannot establish that two particle-size distributions are equivalent.
D90 is not an absolute maximum. It marks the point below which 90% of the stated distribution falls, leaving a portion above that size. An effective top size is a separate descriptor with its own definition. It should not be relabelled as D90 without evidence that the definitions match.
A concrete example appears in the 3M™ Ceramic Microspheres data sheet. The table reports W-410 at 9 µm at the 50th percentile and 21 µm at the 90th percentile. However, the table does not state the PSD weighting or measurement method. Calling these values volume-weighted Dv50 and Dv90 would add information that the source does not supply.
When reviewing a PSD, record the grade, units, measurement method, distribution weighting and reported percentiles. If the method or weighting is missing, ask the supplier before making a detailed comparison. Do not infer an absolute maximum from D90 or substitute an effective top size for a percentile.
Separate typical properties from acceptance requirements
A typical value describes a representative material property. It is useful for understanding a product and making preliminary estimates, but it is not automatically a guaranteed limit for every delivered batch.
An acceptance specification serves a different purpose. It establishes the requirement against which material conformity is assessed. That requirement should identify the applicable property, limit and test method, together with any relevant conditions.
Imagine that a purchasing team needs consistent powder handling and receives a TDS listing a typical bulk density. That value can help with initial planning. It does not, by itself, establish a contractual acceptance limit or justify rejecting a delivery that differs from the typical value.
The distinction becomes particularly important when comparing suppliers. One document may report a typical result, while another may provide a defined specification limit. Comparing the numbers without recognising their different status can produce a misleading conclusion.
Before using a property for purchasing or quality control, establish whether it is typical or specified. If the property must determine acceptance, obtain the applicable specification, test method and agreed acceptance criteria.
Interpret mechanical data within its test scope
A mechanical result is not a complete description of how microspheres will behave in every manufacturing process. It must be read as a combination of the applied loading or pressure, test method, survival criterion and material scope.
The 3M™ Ceramic Microspheres data sheet reports crush strength using an 80% survival-by-volume criterion. The sheet does not provide the full crush-test protocol, so the result should not be interpreted as though every detail of the test were known.
Survival by volume is not the same as survival by particle count. A volume-based criterion concerns the surviving volume under the stated test definition. A count-based criterion concerns the proportion of individual particles surviving. Those measures can differ because particles do not all contribute the same volume.
Even a clearly defined laboratory result does not guarantee survival in a particular production process. The test result describes performance under its own conditions, not an assurance that the same outcome will occur during a customer's processing or in the finished formulation.
Crush-strength data provide a useful basis for material selection when interpreted according to the manufacturer's stated test conditions and survival criteria. Actual performance should be evaluated under the intended processing conditions. Nanovision can assist customers in understanding the available technical data and selecting suitable materials for further evaluation.
Turn the data sheet into a useful supplier discussion
A technical data sheet is most useful when its values are considered in the context of a specific application. It helps identify which properties are relevant, what the reported figures mean and where further clarification or practical evaluation may be needed.
When discussing a material with Nanovision, share your intended application, target properties, processing conditions and, where available, the exact product grade and technical data sheet. This allows us to review the available technical information in relation to your requirements, including density, particle size, specifications and mechanical performance.
Where practical evaluation is needed, a representative sample should be tested under processing conditions relevant to the intended application. Performance criteria should reflect the requirements of the final formulation or manufacturing process. Manufacturer data provides a valuable starting point, while application-specific testing helps confirm material suitability.
For safety information, consult the applicable product label and Safety Data Sheet (SDS). Nanovision can assist with available technical documentation, material selection guidance and current product availability. Regulatory compliance and suitability for a specific application must be assessed according to the intended use.
Bring the Right Questions to Your Material Review
For technical support with a microsphere data sheet, share the grade, document, intended application and any unclear property or test basis with us through the formulation support form.
Request for document support
Conclusion
Understanding those distinctions helps formulators and technical buyers make defensible calculations, compare materials on a consistent basis and focus testing on the uncertainties that matter.
Sources
1. 3M Ceramic Microspheres. Physical-property tables and technical qualifications.
2. Technical Glossary - Nanovision Chemicals. Definitions of technical data sheet; density, loose bulk density, tapped bulk density, true particle density and skeletal density; particle-size distribution, D10, D50 and D90; number-, volume- and mass-weighted particle-size distributions; and typical property.
You might also be interested in...



You might also be interested in...


How can we help you?

24 Vasilissis Olgas Str. | 15124 | Athens | Greece
Phone: (+30) 213 0907763
Reg. Nr.: 181737601000
VAT. Nr.: 802731899
